Data Analyst vs Data Scientist: Which One Fits You Better?
One role mostly explains what already happened through reports and dashboards; the other builds models to estimate what happens next — and the routes in differ.
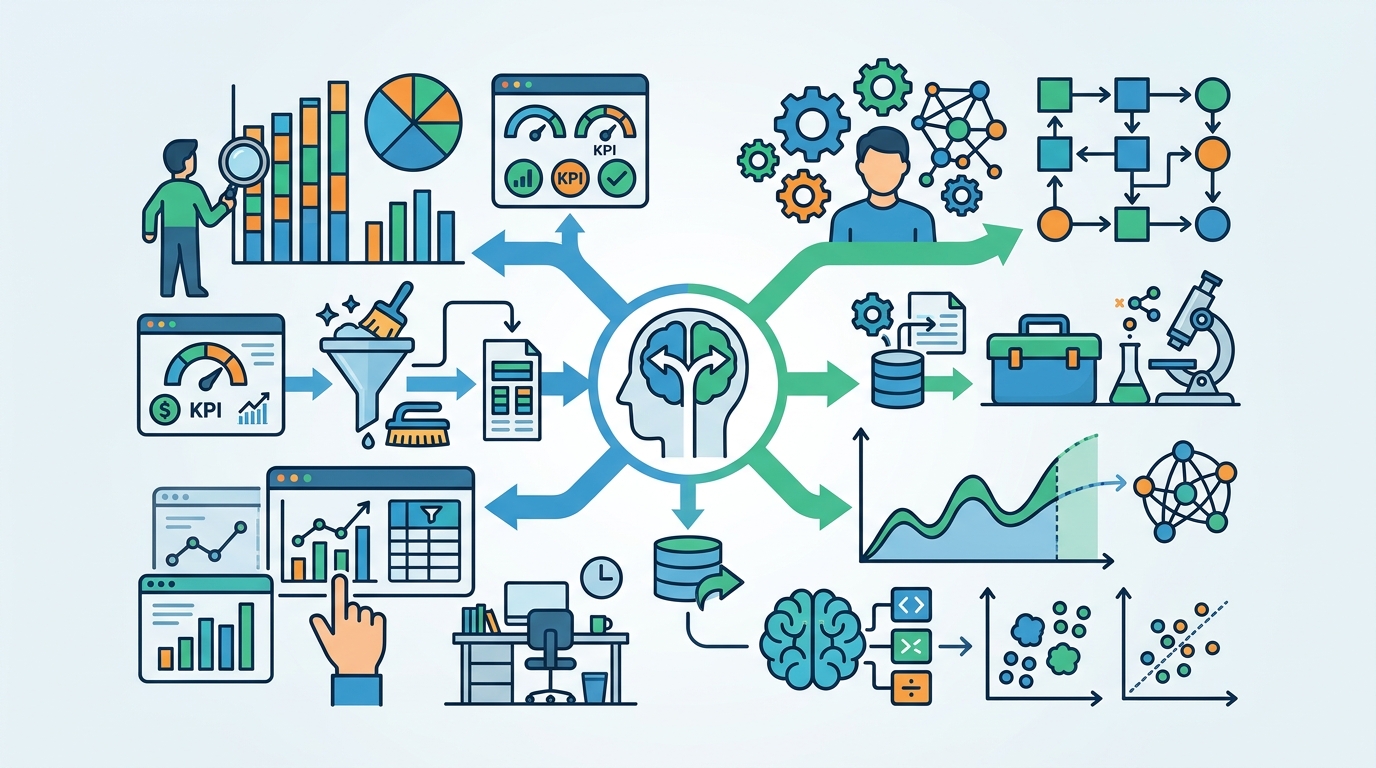
A data analyst is usually handed a defined business question and answers it with SQL queries, spreadsheets and dashboards; a data scientist is more often handed an open-ended problem and answers it with statistical models and code. The work overlaps heavily in the first year, then splits as the analyst goes deeper into reporting and stakeholder decisions and the scientist goes deeper into statistics and engineering.
One quirk shapes any comparison: the U.S. Bureau of Labor Statistics has no detailed occupation called "data analyst" in the 2018 SOC and publishes no wage estimate under that name (mastersindatascience.org, 2025), while O*NET OnLine lists "Data Analyst" as a reported job title under Business Intelligence Analysts, code 15-2051.01 (Seattle University). So this guide compares data scientists as BLS defines them with the Business Intelligence Analyst occupation that most analyst postings map to.
Data Analyst vs Data Scientist at a Glance
Both columns are scored on the same metrics, in the same order. "Data Analyst" here means the O*NET occupation that title reports into, Business Intelligence Analysts (15-2051.01).
| Metric | Data Analyst (Business Intelligence Analysts, 15-2051.01) | Data Scientist |
|---|---|---|
| Typical entry-level education | O*NET OnLine publishes the education level needed for Business Intelligence Analysts and also reports the share of survey respondents naming the education required of new hires — read both on the Education tab for 15-2051.01; postings commonly ask for a bachelor's degree in business, economics, information systems or statistics | The U.S. Bureau of Labor Statistics (2025) publishes the typical entry-level education for data scientists in its Occupational Outlook Handbook; postings commonly ask for a bachelor's degree in statistics, mathematics or computer science, with master's degrees common on research-heavy teams |
| Median pay (source and year) | No BLS wage estimate exists under this job title, because the 2018 SOC has no detailed "data analyst" occupation (mastersindatascience.org, 2025); BLS did report May 2025 median annual wages for the occupations that overlap with analyst titles (mastersindatascience.org, 2025), and New York State's Department of Labor career tool lists a starting salary figure for Business Intelligence Analysts — check both for current numbers | A 2025 median annual pay figure is published by the U.S. Bureau of Labor Statistics (2025) in the Occupational Outlook Handbook entry for Data Scientists; look it up there, then compare against O*NET's wage range for your state |
| Typical hours | O*NET OnLine describes the typical weekly schedule and work setting for business intelligence analysts; in practice full-time and desk-based, with crunches at month-end, quarter-end and board-reporting weeks | BLS (2025) describes the typical schedule for data scientists; in practice full-time, with longer stretches before a model ships or a product launch |
| Physical demands | Low: seated screen work, keyboard-heavy, frequent meetings and presentations to managers and clients | Low: seated screen work, keyboard-heavy, long uninterrupted blocks for coding and model runs |
| Entry barrier | Moderate: a portfolio of SQL queries, a cleaned dataset and two or three Power BI or Tableau dashboards can carry an application; many people enter from finance, operations or marketing reporting | Higher: BLS (2025) lists work experience in a related occupation as typically needed, plus on-the-job training, so employers often expect prior analyst, research or engineering work before the title |
| Common first job title | Business Intelligence Analyst, Reporting Analyst, Marketing Analyst or Operations Analyst | Data Analyst or Research Analyst first, then Data Scientist I or Junior Data Scientist |
| Core named tasks (O*NET) | Generating standard or custom reports summarizing business, financial or economic data for executives, managers, clients and other stakeholders; maintaining or updating business intelligence tools, databases, dashboards, systems or methods | Analyzing data with statistical software; creating graphs, charts or other visualizations to convey the results of data analysis |
| Named tools to learn | SQL, Excel, Microsoft Power BI, Tableau — ONET's Hot Technologies list for 15-2051.01 names the top in-demand technologies for this occupation (Seattle University, citing ONET OnLine) | Python with pandas and scikit-learn, R, SQL, Git, and a cloud warehouse such as Snowflake or Google BigQuery |
| Published outlook | No BLS projection exists under a standalone data analyst occupation (mastersindatascience.org, 2025); use the O*NET 15-2051.01 outlook and your state's projections instead | BLS (2025) publishes the number of data scientist jobs in 2025 and a projected 2025–35 outlook in the Occupational Outlook Handbook — read the percentage there rather than in job-board marketing |
ONET also assigns Business Intelligence Analysts a Job Zone classification (ONET OnLine), which summarises how much preparation the occupation needs; it is worth reading alongside the education tab before you commit to a degree.
Where These Careers Overlap
The first year of either job looks similar from the outside, and the shared ground is specific.
- SQL against a warehouse. Both pull their own data. You write joins across an orders table and a customer table, check row counts after the join, and find out why revenue in your query disagrees with finance's number.
- Visual communication of results. O*NET lists creating graphs, charts or other visualizations to convey results of data analysis as a data scientist task, and maintaining dashboards as a business intelligence analyst task. Both end up defending a chart in a meeting where someone asks why last month dipped.
- Cleaning before analysing. Deduplicating records, handling nulls, reconciling two systems that spell the same product name differently.
- Explaining a method to a non-technical manager. A marketing director who wants one number does not want your confidence interval, but you still have to make the uncertainty land.
Because of that overlap, SQL, Python and a BI tool such as Power BI or Tableau count towards either path.
Where They Diverge
The single biggest practical divergence is the shape of the question you are handed, and that drives the rhythm of your week.
An analyst usually receives a defined question with a deadline attached. Scenario: it is the second working day of the month, and the operations director needs the regional performance pack before Thursday's leadership meeting. You refresh the Power BI model, chase a broken data feed from the warehouse, rebuild one chart because last quarter's categories changed, write three bullet points explaining why returns rose in one region, and present it. O*NET's task statements for business intelligence analysts capture this directly: generating standard or custom reports for executives, managers, clients and other stakeholders, and maintaining or updating business intelligence tools, databases, dashboards, systems or methods. The work is recurring, visible and deadline-dense.
A data scientist more often receives an open question with no obvious answer. Scenario: the product team asks which customers are likely to cancel next quarter. You spend a week defining what "cancel" means in the data, build a baseline model in Python with scikit-learn, discover that the strongest predictor is a logging artefact, start again, and then work with an engineer to get scoring running on a schedule. O*NET lists analyzing data with statistical software as a core data scientist task, and BLS (2025) notes that related work experience and on-the-job training are typically needed — which is why this autonomy is rarely handed to someone in their first role.
One path is measured in reports delivered; the other in questions answered, sometimes after a month with nothing to show.
Which Path Fits You Better
Column A is data analyst (Business Intelligence Analyst). Column B is data scientist. Each item maps to one of the comparison metrics above. If you check more boxes in column A, start by applying directly to reporting and BI analyst roles; if you check more boxes in column B, plan for a longer runway and expect an analyst or research role first, because BLS (2025) lists related work experience as typically needed for data scientists.
- Education — A: you would rather stop at a bachelor's in business, economics or information systems and learn on the job. B: you are willing to consider a master's in statistics or computer science for research-heavy teams.
- Pay research — A: you are comfortable pricing a role yourself from O*NET 15-2051.01 and state tools, since BLS publishes no wage for a standalone data analyst occupation (mastersindatascience.org, 2025). B: you want a published national median to benchmark against, as BLS (2025) provides for data scientists.
- Hours — A: recurring month-end and quarter-end reporting deadlines suit you. B: you prefer longer project cycles with crunch concentrated near a model launch.
- Physical and work setting — A: you want meetings, presentations and desk work mixed through the day. B: you want long uninterrupted coding blocks and fewer interruptions.
- Entry barrier — A: you want to apply within a few months on a portfolio of SQL queries and two or three dashboards. B: you accept that employers often expect prior analyst, research or engineering experience plus on-the-job training first.
- First job title — A: Reporting Analyst, Marketing Analyst or Business Intelligence Analyst reads like a good start. B: you are aiming at Data Scientist I and treating an analyst title as a stepping stone.
- Core task — A: generating standard or custom reports summarizing business or financial data for executives and clients sounds like your kind of day (ONET). B: analyzing data with statistical software sounds like your kind of day (ONET).
- Tool investment — A: you would rather get very good at SQL, Excel, Power BI and Tableau. B: you would rather get very good at Python with pandas and scikit-learn, R and Git.
- Outlook data — A: you are fine using state projections and O*NET because no national projection exists under the data analyst title. B: you want the BLS 2025–35 projection and 2025 employment count for data scientists before you commit.
- Tolerance for dead ends — A: you want something delivered every week. B: you can spend a month on a model that ends up discarded and call that a useful result.
Frequently asked questions
Do I need a master's degree to become a data scientist?
Not automatically. The U.S. Bureau of Labor Statistics (2025) publishes the typical entry-level education for data scientists in its Occupational Outlook Handbook, and also lists work experience in a related occupation plus on-the-job training as typically needed. Read all three fields together before enrolling in anything.
Is data analyst a realistic stepping stone to data scientist?
Yes, and it is a common one. Because BLS (2025) lists related work experience as typically needed for data scientists, time spent writing SQL, cleaning warehouse data and building Power BI reports as an analyst counts. Add Python, scikit-learn and Git alongside the analyst work.
Why can't I find a BLS salary for data analysts?
Because the 2018 SOC contains no detailed occupation by that name, so BLS publishes no wage estimate for it (mastersindatascience.org, 2025). O*NET lists Data Analyst as a reported job title under Business Intelligence Analysts, 15-2051.01 (Seattle University) — use that page, plus your state labor department's figures.
Which tools should I learn first for a data analyst job?
Start with SQL, then Excel, then one BI tool — Microsoft Power BI or Tableau. O*NET's Hot Technologies list for Business Intelligence Analysts names the top in-demand technologies for the occupation (Seattle University, citing O*NET OnLine), so check it against the postings you are actually targeting.
Sources
- U.S. Bureau of Labor Statistics — Data Scientists : Occupational Outlook Handbook (2025)
- mastersindatascience.org — Guide to Data Analyst Salaries (2025)